Graph Writing # 109 - The chart gives information about the UK's ageing population
- Details
- Last Updated: Tuesday, 28 July 2020 12:29
- Written by IELTS Mentor
- Hits: 64987
IELTS Academic Writing Task 1/ Graph Writing - Column Graph:
» You should spend about 20 minutes on this task.
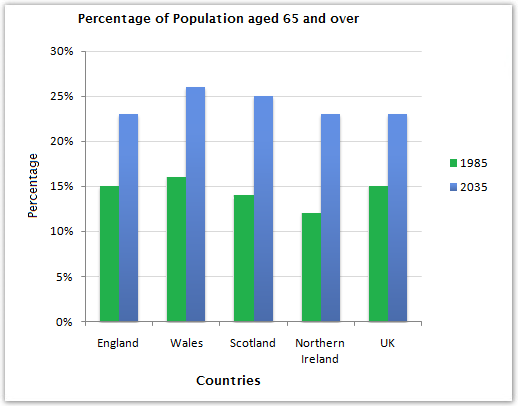
The chart below gives information about the UK's ageing population in 1985 and makes predictions for 2035.
Summarise the information by selecting and reporting the main features, and make comparisons where relevant.
» Write at least 150 words.

Sample Answer 1:
The given bar graph gives data on the old population of the United Kingdom for the year 1985 and also gives the projection for the year 2035.
As is observed from the given data, there were around 10% to 15% aged people who were more than 65 years old in 1985 in England, Wales, Scotland, Northern Ireland and the UK. Among these countries that form the United Kingdom, the highest percentage of those aged people were in Wales amounting about 16% and the lowest percentage was in Northern Ireland which was about 12%.
The bar graph also shows the projection of the aged people in those countries and according to the projection, there would be a mentionable increase in the percentage of those aged people in 2035. The population over 65 years old would be around 25% and that represents the improvement of the lifespan of people in these countries. Wales would have the highest percentage of aged people among the given country which would be around 27%.
Model Answer 2:
The column graph gives the ratio of elderly population in different constituent parts in the UK in 1985 and also gives a prediction of this proportion in 2035 in these countries. Overall, Wales had the highest proportion of senior citizens in 1985 and the percentages of elderly people in all these locations will upsurge in the future.
Getting back to the details, 15% population in the UK was over 64 years old in 1985 and this ratio was the highest in Wales - around 16.5%. Around a person out of 7 was a senior citizen in England and Scotland and this ratio of elderly generation in Northern Ireland was slightly lower. It is predicted that the ratio of the older populace in 2035 will increase remarkably and one out of four persons in Wales and Scotland would be over 64 years old. The ratio of elderly people in other countries in the UK would be between 22 to 23 percentages which will be a significant growth than that of 1985.

Generally speaking, the ageing population in the UK in 1985 were remarkably lower than the predicted year’s ageing people and the country that had a higher older population belongs to Wales for the given years.
According to the given information, Wales had more than 15% of aged people in 1985 and it was projected that in 2035 it will be exponentially higher to more than 25%, a number that surpassed all other countries in the given years. The second rank for who had the highest percentage of the aged population belonged to England with 15% of senior citizens in 1985 and that will be approximately 23% in 2035. Besides, Scotland had just below 15% age citizens in 1985 and it is expected to surplus the ratio of elder people in England in 2035. Finally, Northern Ireland and the UK had an ageing population of around 12.5% and 15.0% in 1985 which was thought to rise in 2035 at the same number of the ageing population (slightly beyond 23%).
Overall, the ratio of senior citizens in the UK will remarkably increase, as the prediction outlines.
As is observed, Wales had the highest percentage of senior citizens (over 64 years old) in both of the years. Meanwhile, 15% of England’s population was elderly in 1985. Aged people were comparatively low, about 12%, in Ireland in the year 1985. However, growth in the ratio of aged people is expected in 2035. The UK will have nearly one-forth senior citizens in the foreseeable future. About 8-10% growth is the ratio of the older population is expected. Wales and Scotland will have 26 and 25 percentages of elderly people respectively.
Report